Getting Started
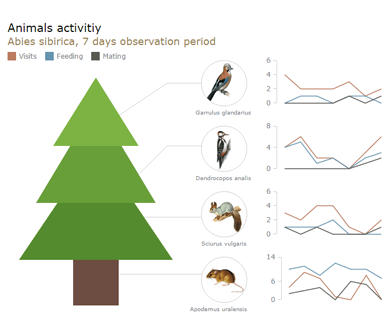
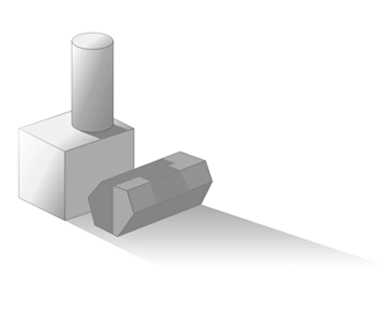
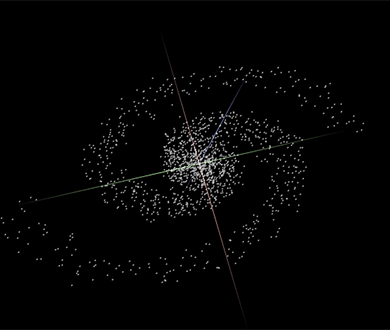
Samples of the things you can easily create using GraphicsJS


Features
Documentation
There are three ways to study GraphicsJS: read articles in the Documentation, browse methods and samples in the API, and study samples in the Playground. As GraphicsJS comes from AnyChart, you may encounter samples where it is called "Anychart Graphics" and where the anychart.graphics namespace is used instead of the acgraph namespace. Don't be alarmed or confused: GraphicsJS is free and open, and you don't need to worry about licensing. Always use the acgraph namespace and you will have no problems whatsoever. We are working hard on detaching GraphicsJS API and Documentation from AnyChart API and Documentation and expect it to be done in a matter of weeks.
Руководство пользователя содержит сотни документов и имеет иерархическую структуру с удобным поиском. Статьи освещают все главные аспекты использования компонента AnyChart и его возможностей. Где необходимо, дополнительно указаны ссылки на другие туториалы, описание API, а также галереи графиков и диаграмм.
В описании JavaScript API перечислены все доступные в наших библиотеках для визуализации данных свойства и методы. В информации о каждом методе приводятся ссылки на примеры, которые можно запускать и исследовать в Песочнице.
Все примеры интерактивных JS графиков и диаграмм, использующиеся в документации, описании API, а также в Чартопедии. Здесь вы можете поиграть с их JavaScript и полным HTML кодом - свободно изменять и перезапускать любой пример.
Where it comes from?
For many years GraphicsJS serves as the graphics engine for AnyChart data visualization products. So it is already battle-tested in thousands of web sites all over the world. You can find it in products and solutions of many Fortune 500 companies.