Getting Started
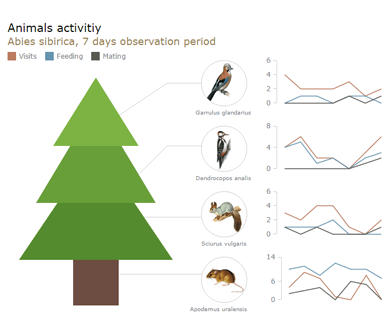
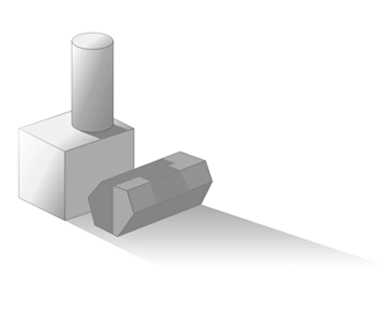
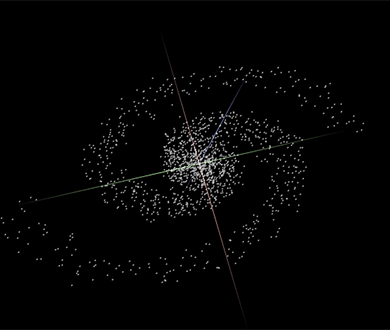
Samples of the things you can easily create using GraphicsJS


Features
Documentation
There are three ways to study GraphicsJS: read articles in the Documentation, browse methods and samples in the API, and study samples in the Playground. As GraphicsJS comes from AnyChart, you may encounter samples where it is called "Anychart Graphics" and where the anychart.graphics namespace is used instead of the acgraph namespace. Don't be alarmed or confused: GraphicsJS is free and open, and you don't need to worry about licensing. Always use the acgraph namespace and you will have no problems whatsoever. We are working hard on detaching GraphicsJS API and Documentation from AnyChart API and Documentation and expect it to be done in a matter of weeks.
يحتوي دليل المستخدم على مئات المستندات القابلة للبحث التي يتم تنظيمها باستخدام ميزة التنقل عبر شجرة. تغطي المقالات جميع الموضوعات الرئيسية حول ميزات مكون AnyChart. يتم توفير روابط إلى برامج تعليمية أخرى، وواجهة برمجة التطبيقات، ومعرض الرسم البياني عند الحاجة.
يسرد مرجع واجهة برمجة التطبيقات JavaScript جميع الخصائص والطرق المتاحة. تأتي كل طريقة مع عينات يمكنك تشغيلها وفحصها في الآلية.
جميع عينات الرسم البياني JS التفاعلية المستخدمة في وثائق AnyChart، ومرجع واجهة برمجة التطبيقات، وChartopedia. يمكنك هنا التلاعب بكود المصدر JavaScript وHTML الكامل وكذلك تعديل أي مثال بحرية وإجراؤه وخلافه.
Where it comes from?
For many years GraphicsJS serves as the graphics engine for AnyChart data visualization products. So it is already battle-tested in thousands of web sites all over the world. You can find it in products and solutions of many Fortune 500 companies.