Getting Started
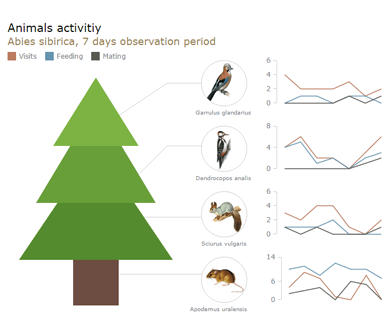
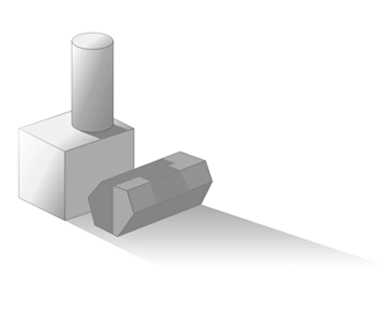
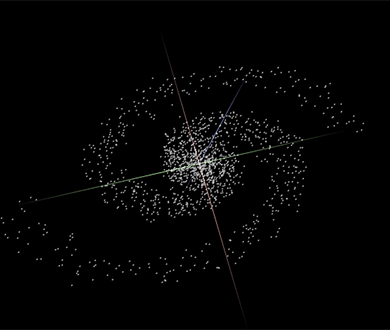
Samples of the things you can easily create using GraphicsJS


Features
Documentation
There are three ways to study GraphicsJS: read articles in the Documentation, browse methods and samples in the API, and study samples in the Playground. As GraphicsJS comes from AnyChart, you may encounter samples where it is called "Anychart Graphics" and where the anychart.graphics namespace is used instead of the acgraph namespace. Don't be alarmed or confused: GraphicsJS is free and open, and you don't need to worry about licensing. Always use the acgraph namespace and you will have no problems whatsoever. We are working hard on detaching GraphicsJS API and Documentation from AnyChart API and Documentation and expect it to be done in a matter of weeks.
La Guía del usuario contiene cientos de documentos organizados en un árbol de exploración con posibilidad de realizar búsqueda. Los artículos cubren todos los temas principales sobre las características de los componentes de AnyChart. En caso necesario, se proporcionan enlaces a otros tutoriales, la API y la Galería de gráficos.
La biblioteca de consulta de la API de JavaScript ofrece la descripción de todas las características y métodos disponibles. Cada método viene explicado con ejemplos que se pueden ejecutar y estudiar en el Laboratorio.
Todos los ejemplos de gráficos JS interactivos utilizados en la documentación de AnyChart, Biblioteca de consulta de la API y Graficopedia. Aquí puede experimentar con JavaScript y código HTML completo, así como modificar libremente cualquier ejemplo, verlo en práctica, etc.
Where it comes from?
For many years GraphicsJS serves as the graphics engine for AnyChart data visualization products. So it is already battle-tested in thousands of web sites all over the world. You can find it in products and solutions of many Fortune 500 companies.