Getting Started
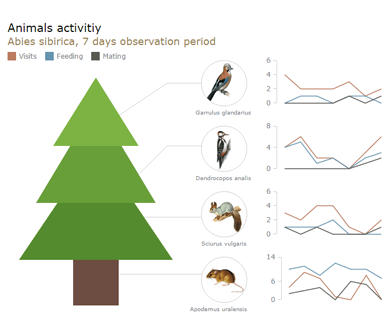
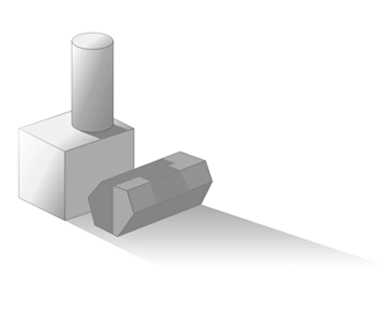
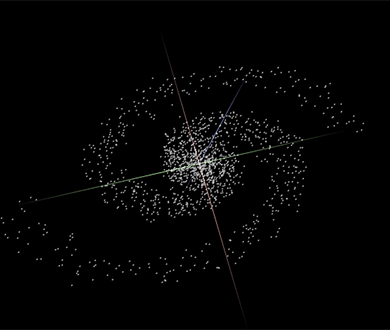
Samples of the things you can easily create using GraphicsJS


Features
Documentation
There are three ways to study GraphicsJS: read articles in the Documentation, browse methods and samples in the API, and study samples in the Playground. As GraphicsJS comes from AnyChart, you may encounter samples where it is called "Anychart Graphics" and where the anychart.graphics namespace is used instead of the acgraph namespace. Don't be alarmed or confused: GraphicsJS is free and open, and you don't need to worry about licensing. Always use the acgraph namespace and you will have no problems whatsoever. We are working hard on detaching GraphicsJS API and Documentation from AnyChart API and Documentation and expect it to be done in a matter of weeks.
ユーザーガイドには、ツリーナビゲーションで構成された数百件もの検索可能な文書が含まれています。AnyChart のコンポーネント機能に関するすべての主なトピックを記事に網羅しています。必要に応じて他のチュートリアル、API、チャートギャラリーへのリンクをご用意しています。
JavaScript API リファレンスには使用可能なすべてのプロパティとメソッドが掲載されています。各メソッドには、プレイグラウンドで実行して動作を確認できるサンプルが付属しています。
AnyChart のドキュメンテーション、API リファレンス、Chartopedia で使用されている JS チャート作成サンプル。ここではそれらの JavaScript や完全な HTML ソースコードを実行することができるだけでなく、任意のサンプルを自由に変更したり実行したりすることができます。
Where it comes from?
For many years GraphicsJS serves as the graphics engine for AnyChart data visualization products. So it is already battle-tested in thousands of web sites all over the world. You can find it in products and solutions of many Fortune 500 companies.